Celadon Power and Performance Test Suite
This guide describes the workloads included in the Celadon Power and Performance (PnP) test suite and provides details for running the tests.
Introduction
Celadon supports deployment models of bare metal, virtual machine, and container. Celadon can be run as the only Google Android instance on the platform, either on a physical hardware device or a host OS using virtualization or containerization technology. Or, it can be run simultaneously with other Celadon instances in a virtual machine or container in the workload consolidation scenario.
Due to the different types of deployment models, there are two supported modes for measuring performance and power on Celadon:
Single-OS mode: only one Celadon instance is launched. When deployed on a host OS, no concurrent host OS workloads are issued, except the required device emulation loads.
Multi-OS mode: multiple Celadon instances are launched and running identical workloads. No loads other than the required device emulation tasks are issued in the host OS.
The Celadon power and performance measurement workloads cover the general purpose usage scenario for Edge devices, as well as scenarios for visual collaboration and portable devices. The full suite of test workloads can be used for single-OS tests, and part of the workloads suite can be modified for multi-OS tests. While the single-OS test items are designed to explore both hardware capability and the end-user experience, the multi-OS test items are focused on the end-user experience of each instance when multiple OSes are running concurrently. In the multi-OS profile, hardware capabilities are shared among multiple instances and the acceptable user experience of each instance is the key indicator to deliver. Refer to the following table for more information about the test workloads.
Category |
Celadon PnP Test Name |
Unit |
Description |
Single-OS |
Multi-OS |
Usage Scenario |
|---|---|---|---|---|---|---|
Video & Camera |
H.264 3840x2160 60fps Playback |
fps |
Accelerated high resolution video playback with display frame rate is reported.
|
Y |
Y |
General |
Peak 1080p H.264 Decoding FPS |
fps |
Peak video decoding frame rate when accelerator 100% saturated.
This case is designed for multi-way media processing.
|
Y |
Visual |
||
Peak 1080p H.264 Encoding FPS |
fps |
Peak video encoding frame rate when accelerator 100% saturated.
This case is designed for multi-way media processing.
|
Y |
Visual |
||
Video Conference - 1080p30 WebRTC |
fps |
Accelerated high resolution video conference, in a loop back environment,
with display frame rate is reported.
|
Y |
Visual |
||
Graphics |
GFXBench5.0 Manhattan 3.1
Benchmark Off Screen
|
score |
Industrial synthesized GPU benchmark, with scores reported.
|
Y |
General |
|
Runtime |
Geekbench Multi Core |
score |
Industrial synthesized CPU benchmark, with scores reported.
|
Y |
Y |
General |
Antutu v6.3.3 |
score |
Industrial synthesized system benchmark, with scores reported.
|
Y |
Y |
General |
|
User Experience |
Touch Display Latency |
ms |
Latency from touch/mouse events to UI response
|
Y |
Y |
General |
Test setup
For the single-OS configuration, the DUT is
connected to a host machine running Ubuntu 18.04. The host machine uses
ADB to download test workloads to and collect
logs from the DUT. For single-OS on a bare metal device, enter
command adb through the USB cable or Ethernet link. For single-OS on
virtualization or containerization platform, the host OS is directly used as the host machine, and connects to the DUT via
adb over the virtual Ethernet link.
A multi-OS configuration that is based on virtualization or containerization
uses the host OS as the host machine for testing and connecting to multiple
DUT via adb over the Ethernet link. Refer to the following feature for
details.
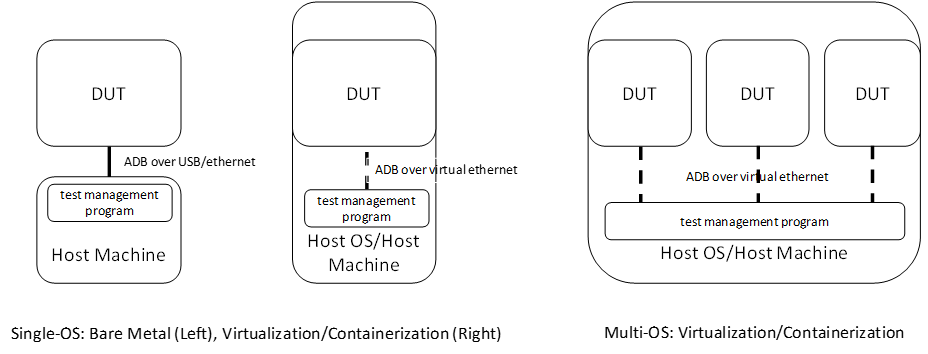
Figure 1. DUT and Host Machine Setup
Test tools
High speed camera (HSC)
An HSC is used to measure FPS and various latencies. As an example, testers can use FLIR Flea*3 USB 3.0 Cameras, which support 640x512 at 480 FPS, or Apple iPhone 6s slow motion mode to capture 240 FPS videos. The captured video sequences should be divided into still frames using FFmpeg or similar tools for further processing.
For FPS measurement, the displayed content on the DUT should be specially designed so that each frame has an obvious difference that can be recognized by a human tester or test automation tools based on visual object detection algorithm. For example, in the video playback FPS test, gray barcodes can be applied to video clips in test to facilitate the detection manually or automatically. In practice, we set the HSC to capture 640x512 video clips at 480 FPS as an example. When the HSC captures videos, the frame interval is 1000 / 480 = 2.083 msec. During our tests, we captured videos continuously for 10 seconds, for a total of 4800 (480 x 10) picture frames, then counted how many unique picture frames based on the signature or bar code were added to each of the frames in the video clip.
For example, the following pictures were captured from a coded (added a signature or barcode) movie. We observed that picture 1 and picture 2 have the same barcode, so it counted as one frame, while picture 3 had a different barcode, so it counted as another unique frame. The total number of unique frames were used to calculate the FPS.
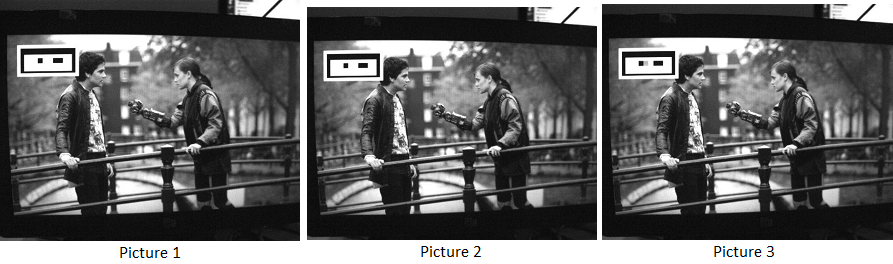
Figure 2. Grey Bar-Coded FPS Calculation
For latency measurements, we used an HSC to capture the gesture/operation step by step as designed by the test cases, and analyzed the snapshots to get the starting and ending points in the operation sequence. For example, the following pictures were captured when we launched the browser. In this example, picture 1 (e.g. picture number 366) marks the time the user touched the screen (i.e. the starting point), and picture 2 (e.g. picture number 583) marks the time when the browser completely rendered on the screen (i.e. the ending point). Based on this information, we calculated the launch time as (583 - 366) x 1000 / 480 = 452 msec.
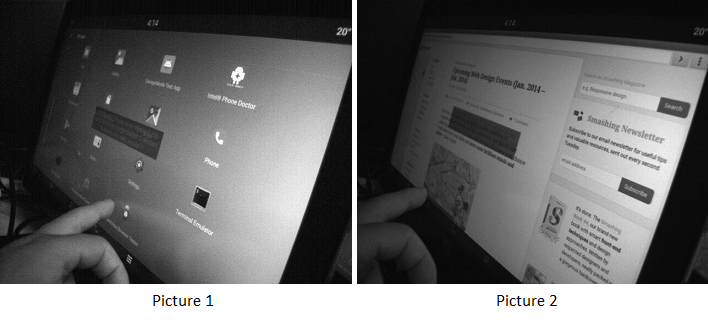
Figure 3. Latency Calculation
The adoption of an HSC is similar for both single-OS and multi-OS test cases, however, for multi-OS tests, multiple objects are used in recognition. HSC methods are accurate, and end to end. If the HSC methodology (and its corresponding frame difference detection mechanism) is not available, users can implement log-based methods to obtain approximate results.
Intel® SoC Watch
The Intel SoC Watch command line tool is used for measuring SoC power consumption in various scenarios.
For example:
System idle scenario, where the system is not in use during the collection time. It’s expected to reduce its energy usage as low as possible. Set a longer collection period (e.g. several minutes) to allow the system to enter deep sleep states.
Active workload, such as video or audio playback. Launch the test programs and start collecting data for a predetermined time period, or manually stop the data collection. Use the help command to learn various options to start/stop the data collection.
Our recommended testing method is:
Push the Intel SoC Watch package to the DUT.
$ adb push socPowerTool /data/
Run the
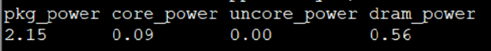
socPowerToolcommand and specify a collection time period (e.g. 1800 seconds) in theadbshell.$ adb shell celadon:/ # /data/socPowerTool --get_power_once 1800
The system returns the average power consumption during the specified time period.
Learn more about the additional data that can be collected on the DUT by entering the help command.
celadon:/ # /data/socPowerTool -h
Test suite
This section describes how to run the workloads included in the Celadon Power and Performance (PnP) test suite and the Key Performance Indicators (KPIs) measured during the tests.
H.264 3840x2160 60fps playback
This KPI measures frame rate of video playback of a locally stored video clip using an HSC.
Environment setup
The device is in a stable state and is not running any other applications.
Set up the HSC environment.
Measurement steps
Download the H.264 3840x2160 60fps video source and push it to the device.
Play the video using the Gallery application or another video playback application.
Calculate the FPS using the HSC.
Peak 1080p H.264 decoding FPS
This KPI measures the capability of parallel multiway decoding using an Intel® Media SDK sample. For example, this could be built with the command:
$ make -j8 BOARD_HAVE_MEDIASDK_OPEN_SOURCE=true sample_decode
The output is located in the out/target/product/cel_kbl/vendor/bin
folder.
Environment setup
The device is in a stable state and is not running any other applications.
Compile or download the decoder sample file.
Download or create an H.264 testing video clip (FFmpeg can be used).
Measurement steps
Push the H.264 video clip and the compiled decoder sample binary file to the test device.
Set the decoder binary file executable and execute the decoder sample binary file to get FPS. Since the single decoder program may not fully utilize all of the decoding engine’s capability on many platforms, create a script to run multiple instances (e.g. 4) of the decoding program in parallel to fully saturate the decoding hardware, and aggregate the reported FPS numbers as the final result.
Peak 1080p H.264 encoding FPS
This KPI measures the capability of parallel multiway encoding using an Intel Media SDK sample. This could be built using the command:
$ make -j8 BOARD_HAVE_MEDIASDK_OPEN_SOURCE=true sample_encode
The output is located in the out/target/product/cel_kbl/vendor/bin
folder.
Environment setup
The device is in a stable state and is not running any other applications.
Compile or download the encoder sample file.
- Download or create a 1080p testing YUV video clip (FFmpeg can be used)
.
Measurement steps
Push the YUV video clip and the compiled encoder sample binary file to the test device.
Set the encoder binary file executable, and execute the encoder sample binary file to get FPS. Since the single encoder program may not fully utilize all of the encoding engine’s capability on many platforms, it’s recommended to create a script to run multiple instances (e.g. 4) of the encoding programs in parallel to fully saturate the encoding hardware, and aggregate the reported FPS numbers as the final result.
Video conference - 1080p30 WebRTC
This KPI measures the smoothness of WebRTC using HSC.
Environment setup
The device is in a stable state and is not running any other applications.
Set up the HSC environment.
Measurement steps
Open a browser and go to
https://apprtc.appspot.comClick Join to enter a room.
Calculate FPS using HSC.
GFXBench 5.0 Manhattan 3.1 benchmark off screen
This KPI measures the graphics performance using the GFXBench application.
Environment setup
The device is in a stable state and is not running any other applications.
Measurement steps
Download the GFXBench benchmark application from the Google Play store and install it.
Launch the GFXBench GL benchmark application and select Manhattan 3.1 Benchmark Off Screen to run.
Get the result.
Geekbench multi-core
This KPI measures the processor and memory performance using the Geekbench application.
Environment setup
The device is in a stable state and is not running any other applications.
Measurement steps
Download the Geekbench app from the Google Play store and install it.
Launch the Geekbench app and run it.
Get the result.
Antutu v6.3.3
This KPI measures system performance using the Antutu application.
Environment setup
The device is in a stable state and is not running any other applications.
Measurement steps
Download the Antutu application from Antutu6.3.3 and install it.
Launch the Antutu app and start testing.
Record the score.
Touch display latency
This KPI measures the latency time from the physical touch event to the screen update using HSC.
Environment setup
The device is in a stable state and is not running any other applications.
Find a screen view that will be changed immediately when a user touches the screen.
Set up the HSC environment.
Measurement steps
Open the screen view.
Open the HSC and start the capture.
Use your finger to tap the screen and wait for the screen to change.
Calculate the latency based on the picture that is captured by theHSC.